I managed to get the udata_list, thanks you your guidance.
However when I try to minimize the negative log likelihood it does not succeed.
I’m using the following :
# this is the only code I modified, for the rest I'm using your functions
def garch_norm_to_u(res):
std_res = res.std_resid
udata = norm.cdf(std_res)
return udata
udata_list = []
#create a list with all fitted models
garch_models = [garch_goog, garch_jpm, garch_nflx]
for model in garch_models:
udata_list.append(garch_norm_to_u(model))
cons = ({'type': 'ineq', 'fun': lambda x: -x[0] -x[1] +1}) bnds = ((0, 0.5), (0, 0.9997))
opt_out = minimize(loglike_norm_dcc_copula, [0.01, 0.95], args = (udata_list,), bounds=bnds, constraints=cons)
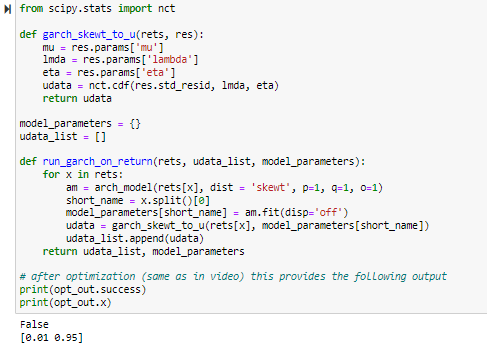
print(opt_out.success)
print(opt_out.x)
I get the following output:
c:\Users\***\anaconda3\lib\site-packages\numpy\lib\function_base.py:2674: RuntimeWarning: invalid value encountered in subtract
c:\Users\***\anaconda3\lib\site-packages\numpy\linalg\linalg.py:2146: RuntimeWarning: invalid value encountered in det
False
[0.01 0.95]
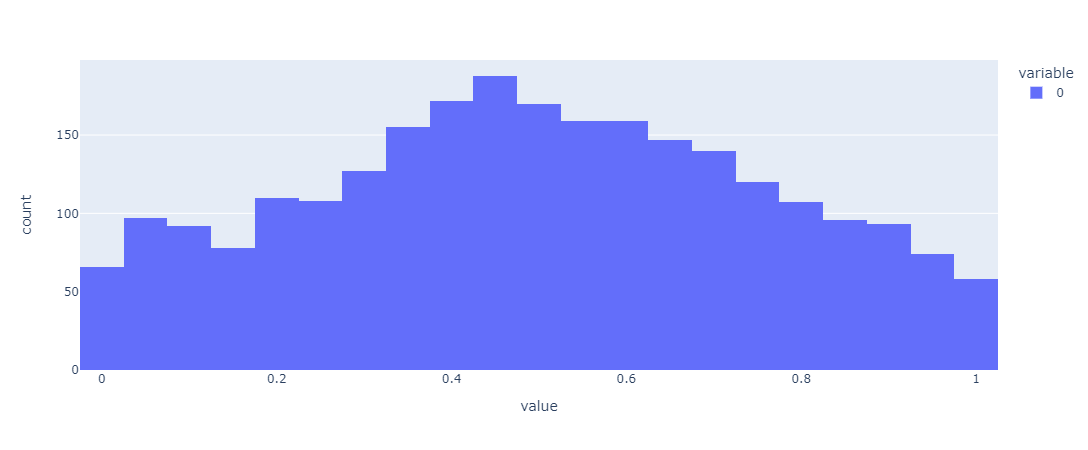
I tried also using the t-student. Also in that case the udata plot looks fairly similar but the optimization converges and I’m able to obtain the estimation of the conditional correlations.
Additional question: is there a way to get the estimated variance univariate series for each stock from the model?
Those plots looks great. Glad you got the optimization to converge
So the univariate estimate you will get from the first part of the code from res.conditional_volatility and that will be your estimate variance for each stock.
Easy!
First of all many thanks for your video. I also had a look at your PhD, which has been very helpful for my own MSc thesis. I am currently struggling with adapting your code to implement a skewed student’s t distribution for a DCC-GJR GARCH model. With the help of the previous replies, I came up with the following code. However, the optimization procedure does not work.
My second question is regarding the statistical significance of the DCC part. You mentioned in a previous post that it is possible to get statistical significance from the alfa and beta values from the optimizer. Could you perhaps provide the code on how to do that?
My apologies for the code-heavy questioning. This is not my greatest strength, so any help is highly appreciated. As there is abundant information on this website the interpretation seems clear to me, so thank you for providing that info!
Hi Mart,
Glad you are finding all the material useful.
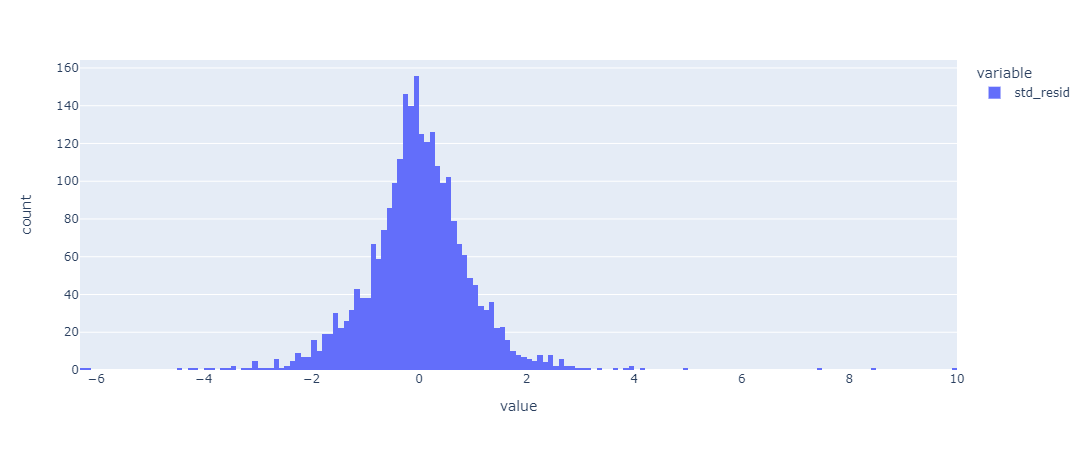
I would start by plotting the udata to check it is indeed uniform.
Are we sure the data has GARCH effects (please tell me it’s not crypto)?
Did the GARCH optimisation give bad results?
Start with that and let me know.
For the second part, I actually would use MCMC to find the solution rather than scipy optmize.
There are some crazy methods for getting interval estimates: notebooks/nelder-mead.md at master · andsor/notebooks · GitHub
but it’s not for the faint hearted.
See if PyMC or something similar could be more useful for you in diagnostics etc.
Can you let me know more about your studies? Great that students are learning this stuff!
If I change the bounds of the optimizer to be equal to [ 0,0], i.e. bnds = ((0, 0), (0, 0)),
for both DCC parameters, does this mean that the model is estimating a CCC-GARCH? Furthermore, is it possible to increase the number of DCC lags in this code?
As with the lags, your mileage might vary, but as with GARCH, (1,1) works the best without introducing the potential for over fitting, more parameters to take care of, and unnecessary complexity.
Nonetheless, it would be a fun exercise to make the code more generic where it can take user specific number of lags.
What data are you fitting the model to?
Cheers
Tino