Link to GitHub
So I’m trying to run the DCC_Garch Model and I’ve entered the following code
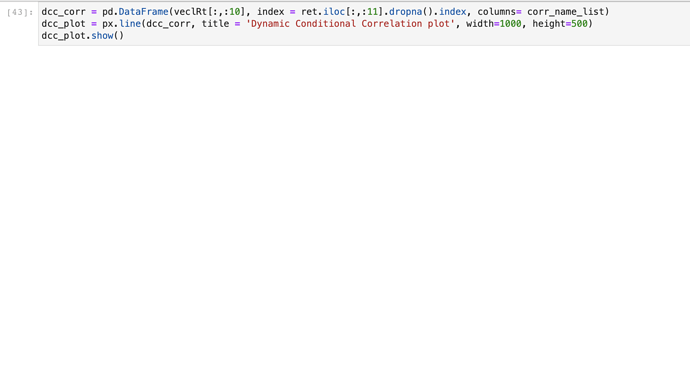
dcc_corr = pd.DataFrame(veclRt, index = ret.iloc[:,:11].dropna().index, columns= corr_name_list)
dcc_plot = px.line(dcc_corr, title = ‘Dynamic Conditional Correlation plot’, width=1000, height=500)
dcc_plot.show()
However, I’m getting this as my error:
ValueError: Shape of passed values is (77, 45), indices imply (77, 10)
Any advices on how to fix it?
Sure, so you have specified ret.iloc[:,:11].dropna().index as your index, so you only want 10 items, but it seems the data itself, veclRt, is still 77 by 45. So you need to also slice veclRt.
Hope that helps
Yes! Thank you… How do we usually do that?
How big is corr_name_list?
what is the output of:
len(corr_name_list)
The code in the notebook should work without any modifications.
Did you use your own return series?
but you can also try:
veclRt[:,:11]
and it should work
It’s my own return series. I’ve just made some more modifications. Thank you for the tip. It’s definitely the corr_name_list. However, the graph isn’t showing up right now… is it cause I’m missing a package?
Hard to tell, what’s the error?
you can do
pip install plotly_express
in your terminal and see if that helps.
Are you in jupyter lab or jupyter notebook?
Thank you! I’ve installed plotly_express… but it’s still not working. Now the error is showing me
AttributeError: module ‘pandas’ has no attribute ‘Dataframe’
Do I have to go back and define Dataframe?
DataFrame has a capital F
Try that
oh yes sorry! yeah I’ve changed it but I still dont see anything. Would this most likely be an installation problem?
It would complain at the import stage if it was that. Can you copy the code you are running and the error as well please?
I’m guessing that it’s an installation issue. Because I’ve tried it on your GitHubt codes and the chart isnt appearing too.
Is there an alternative code that can be suggested? I think it’s just plotly.express px isnt working.
Plenty of plotting packages out there
Seaborn
Matplotlib
Even df.plot() will render something.
Sorry Tino!
I do have one last question.
When you’ve coded this section… what does it mean?
for i, name_a in enumerate(stock_names):
if i == 0:
pass
else:
for name_b in stock_names[:i]:
corr_name_list.append(name_a + “-” + name_b)
For my data, I basically ordered in a very similar way having TSLA…XXX…YYY…BBB… and these different securities. Is there a way for me to create a dcc between TSLA with XXX and then TSLA with YYY and TSLA with BBB? Kind of like a [1]x[1,2,3,4,5,6,7,8,9,10] matrix.
Look at itertools, either permutations or combinations is your friend
corr_name_list = []
for i, name_a in enumerate(stock_names):
if i == 0:
pass
else:
for name_b in stock_names[:i]:
corr_name_list.append(name_a + “-” + name_b)
This line is already in the code, in cell 17. It should give you all the combinations. TSLA with everything else too
Thank you Tino! I’ve managed to get through it.
Thank you so much!
Any chance that you’ve worked with Wavelet Coherence before?

