Hi Tino!
I was playing around with the DCC copula for multivariate t distribution and ended up coding the PDF and log PDF functions from scratch. Only later I found that scipy has it built in and implementing it for the log-likelihood copula function can be done in a straightforward manner, please see below, I’ve re-used the code from your example 
def ll_t_dcc_copula(theta, udata):
    N, T = np.shape(udata)
    llf = np.zeros((T,1))
    _, _, df = theta
    trdata = np.array(stats.t.ppf(udata_list, df).T, ndmin=2)
    Rt, veclRt = dcceq(theta[:2], trdata)

    for i in range(0,T):
        llf[i] = stats.multivariate_t.logpdf(trdata[i,:], None, Rt[:,:,i], df) - stats.t.logpdf(trdata[i,:], df).sum()
    llf = np.sum(llf)

    return -llf
The mean vector was set to None, which simply defaults a zero vector of length N. I’ve performed the estimation on a set of NYSE/NASDAQ stocks and the parameters looked plausible, given the nature and volatility of the underlying log-returns. What I was curious about, when inspecting GARCH-t transformed log-return pairs, prior to fitting the t-Copula. Their histograms looked somewhat off, as if the transformation did not result in the desired uniform property, please see image below:
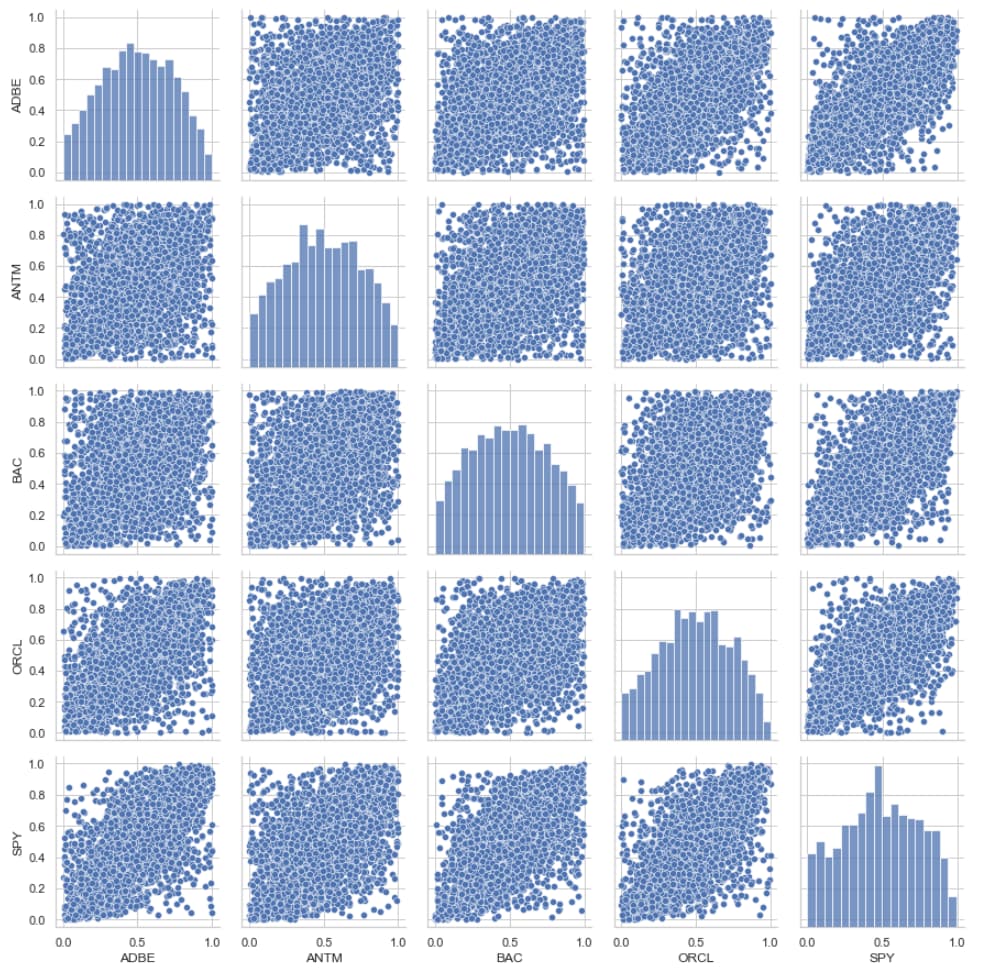
What does this look like to you? I’ve fitted each time-series with a univariate GARCH (1,1) model, with t distributed errors. The transformation to uniform observations was performed by a modification of the function you provided, please see below:
def garch_t_to_u(rets, res):
    nu = res.params['nu']
    udata = stats.t.cdf(res.std_resid, nu)
    return udata
Here the only change is that I am using the arch package std_resid method, which generates the so-called devolatized time-series, where model residuals are divided by the conditional volatility.
A similar scipy call can be re-used also for the normal Copula log-likelihood, where I’ve made a comparison to your implementation and the log-likelihood sums matched to a decimal point:
def ll_norm_dcc_copula(theta, udata):
    N, T = np.shape(udata)
    llf = np.zeros((T,1))
    trdata = np.array(stats.norm.ppf(udata).T, ndmin=2)
    Rt, veclRt =  dcceq(theta, trdata)

    for i in range(0,T):
        llf[i] = stats.multivariate_normal.logpdf(trdata[i,:], cov=Rt[:,:,i]) - stats.norm.logpdf(trdata[i,:]).sum()
    llf = np.sum(llf)

    return -llf
For the skew-t multivariate distribution I presume some work from scratch would be required to code the log-likelihood function for DCC Copula estimation! I will look into the thesis you provided for the appropriate skew-t formulas.
I am now looking into coding an N-day DCC prediction step for the conditional correlations. My idea is to forecast between 30-90 days ahead, but I am fearful errors will start creeping in pretty fast. Do you maybe have a suggestion of a forecast horizon which can provide a reasonable balance ? Many thanks!
Hope this helps! Cheers and have a relaxing weekend!
N.